
Stop Checking Dashboards — Let n8n Email You Google Analytics Reports Instead!

Do you still open Google Analytics every Monday to see if your website’s traffic went up?
Yeah… same here — until I automated the whole thing.
In this post, we’ll create a workflow that fetches your site metrics from Google Analytics, formats them into clean HTML, and emails them to you automatically using n8n, the open-source automation platform that’s basically Zapier on steroids (and self-hostable).
🎯 What You’ll Learn
- What Google Analytics is and how to include it in your website
- How to retrieve analytics data using the Google Analytics node in n8n
- How to transform the data into HTML reports
- How to email those reports automatically every week
📈 What Is Google Analytics?
Google Analytics is a free service from Google that tracks and reports website traffic.
It tells you where your visitors come from, how long they stay, and which pages they love (or ignore).
It’s like a personal detective for your website — always watching, collecting clues, and giving you data to improve your content or performance.
💻 How to Add Google Analytics to Your Website
- Go to analytics.google.com and create a GA4 Property for your site.
- Copy your Measurement ID (it starts with
G-XXXXXXXX). - Paste this snippet into your website’s
<head>section, right before</head>:
<!-- Google tag (gtag.js) -->
<script async src="https://www.googletagmanager.com/gtag/js?id=G-XXXXXXXX"></script>
<script>
  window.dataLayer = window.dataLayer || [];
  function gtag(){dataLayer.push(arguments);}
  gtag('js', new Date());
  gtag('config', 'G-XXXXXXXX');
</script>
- Save your changes and publish your website.
- Wait a few hours (or up to 24) for Google Analytics to start collecting data.
- In your Analytics dashboard, check the Realtime view — you’ll see your own visit pop up almost immediately.
🔠Connecting n8n to Google Analytics (OAuth2 Setup)
Before your n8n workflow can access your Google Analytics data, you’ll need to create credentials in the Google Cloud Console.
This allows n8n to authenticate securely with your Google account using OAuth2.
Steps to Create Your Google App
- Go to the Google Cloud Console.
- If you don’t have a project yet, click “New Project†and give it a name (for example, n8n-analytics-automation).
- On the left sidebar, navigate to APIs & Services → Credentials.
- Click “Create Credentials → OAuth client ID.â€
- Choose Web application and enter a name (e.g., n8n Google Analytics Connector).
- Under Authorized redirect URIs, add your n8n instance URL followed by
/rest/oauth2-credential/callback.- Example:
https://n8n.yourdomain.com/rest/oauth2-credential/callback
- Example:
- Click Create, and you’ll receive a Client ID and Client Secret.
- Save these values — you’ll use them when creating your Google Analytics OAuth2 credential in n8n.
Enable the Right Scopes
When prompted to configure scopes, make sure to include at least:
https://www.googleapis.com/auth/analytics.readonly
This grants n8n permission to read metrics from your GA4 property (no write access required).
For Sending Email via Gmail (optional)
If you want n8n to send emails using your Gmail account instead of an SMTP relay, you’ll also need:
https://www.googleapis.com/auth/gmail.send
This allows n8n’s Email node to send messages securely through Gmail’s API on your behalf.
You can review Google’s official setup guide here:
🔗 Set up OAuth 2.0 access for Google APIs
Once these credentials are configured inside n8n (under Credentials → Google OAuth2 or Google Analytics OAuth2), your workflow will be able to connect, query metrics, and send email reports seamlessly.
âš™ï¸ The n8n Workflow
Now comes the fun part — automation.
We’ll use n8n to grab your site’s Google Analytics data, format it, and send it via email.
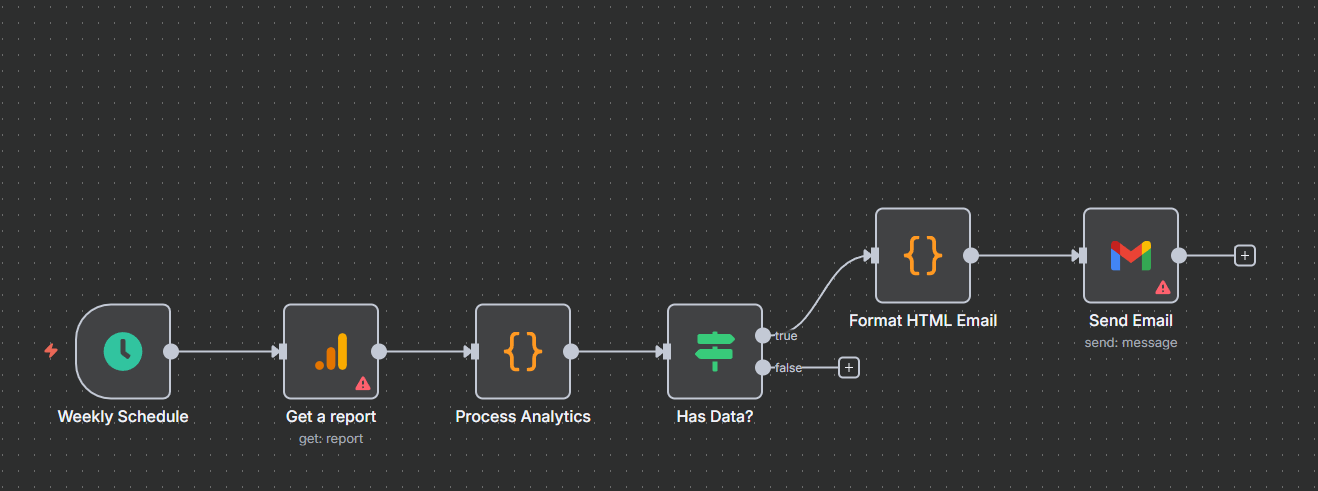
You can import the provided JSON workflow:
1ï¸âƒ£ Google Analytics Node
This node connects to your GA4 property using OAuth2 and retrieves metrics for a specific date range.
Typical setup:
- Property ID:
YOUR_GA4_PROPERTY_ID - Date Range:
last_7_days - Metrics:
activeUsers,newUsers,screenPageViews,averageSessionDuration - Dimensions:
date
Example output:
[
  { "date": "2025-10-01", "activeUsers": 312, "screenPageViews": 890 },
  { "date": "2025-10-02", "activeUsers": 420, "screenPageViews": 1012 }
]
2ï¸âƒ£ Code Node — Format the Result as HTML
The JSON data is machine-friendly, but not something you want to read before coffee.
Let’s format it into a sleek HTML report:
const rows = items.map(item => `
<tr>
<td>${item.json.date}</td>
<td>${item.json.activeUsers}</td>
<td>${item.json.screenPageViews}</td>
</tr>
`).join("");
return [{
json: {
html: `
<h2>Weekly Google Analytics Report</h2>
<table border="1" cellpadding="6" cellspacing="0" style="border-collapse:collapse;font-family:Arial;">
<thead><tr><th>Date</th><th>Active Users</th><th>Page Views</th></tr></thead>
<tbody>${rows}</tbody>
</table>
<p>Generated automatically by your n8n workflow âš™ï¸</p>
`
}
}];
3ï¸âƒ£ Email Node — Send the Report
Use the Email Send node to deliver the formatted HTML report.
- From:
noreply@yourdomain.com - To: your inbox (or multiple recipients)
- Subject:
Weekly Google Analytics Report - HTML Body:
{{$json["html"]}}
You can also attach a CSV if you want a downloadable summary.
4ï¸âƒ£ Cron Node — Schedule It
Finally, add a Cron Trigger to run the workflow every Monday at 8:00 AM.
{
  "mode": "everyWeek",
  "weekly": {
    "weekday": "monday",
    "hour": 8
  }
}
That’s it — you’ll receive a fresh analytics report every Monday morning, without lifting a finger.
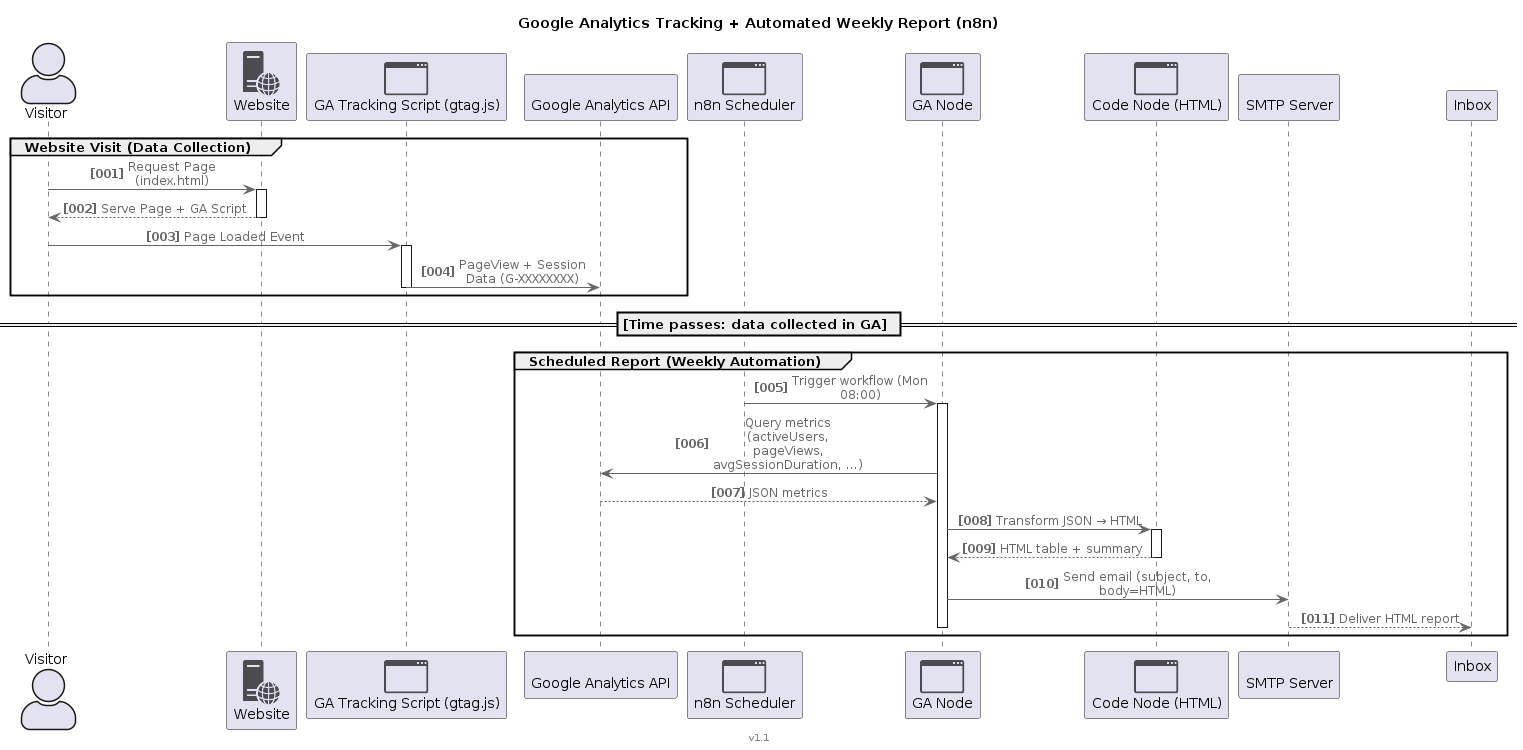
🧠Putting It All Together — Sequence of Events
First, Google Analytics collects page views from your website via the gtag.js tracking code.
Later, n8n wakes up on schedule, queries your metrics, formats them as HTML, and emails them.
@startuml

!include <C4/C4_Container>
!include <tupadr3/common>
!include <office/Concepts/application_generic>
!include <office/Servers/web_server>

title Google Analytics Tracking + Automated Weekly Report (n8n)

actor "Visitor" as visitor
participant "<$web_server>\nWebsite" as web
participant "<$application_generic>\nGA Tracking Script (gtag.js)" as gtag
participant "<$google>\nGoogle Analytics API" as gaapi
participant "<$application_generic>\nn8n Scheduler" as cron
participant "<$application_generic>\nGA Node" as ganode
participant "<$application_generic>\nCode Node (HTML)" as code
participant "<$mail_server>\nSMTP Server" as smtp
participant "Inbox" as inbox

autonumber "<b>[000]"

group Website Visit (Data Collection)
  visitor -> web: Request Page (index.html)
  activate web
  web --> visitor: Serve Page + GA Script
  deactivate web

  visitor -> gtag: Page Loaded Event
  activate gtag
  gtag -> gaapi: PageView + Session Data (G-XXXXXXXX)
  deactivate gtag
end

== [Time passes: data collected in GA] ==

group Scheduled Report (Weekly Automation)
  cron -> ganode: Trigger workflow (Mon 08:00)

  activate ganode
  ganode -> gaapi: Query metrics\n(activeUsers, pageViews, avgSessionDuration, …)
  gaapi --> ganode: JSON metrics

  ganode -> code: Transform JSON → HTML
  activate code
  code --> ganode: HTML table + summary
  deactivate code

  ganode -> smtp: Send email (subject, to, body=HTML)
  smtp --> inbox: Deliver HTML report
  deactivate ganode
end

footer v1.1
@enduml
🧩 Bonus Enhancements
- Add a Code node to calculate percentage growth week-over-week.
- Embed a Chart.js visualization for trend graphs.
- Use NTFY from a previous post to push a mobile notification once the email is sent.
- Add your own logo and brand colors for that executive-report touch.
🧵 Wrap-Up
You just automated one of the most repetitive tasks in digital marketing.
With this setup:
- Google Analytics tracks your visitors
- n8n fetches the metrics automatically
- JavaScript formats the data
- The Email node delivers it
- The Cron node makes sure it happens like clockwork
No more logging in. No more exporting CSVs.
Just fresh data, neatly presented, waiting in your inbox.
Happy automating!!!